Distributed Context Propagation with otel4s
Distributed Context Propagation with otel4s
Distributed systems allow for building highly scalable and fault tolerant applications. Methodologies like event sourcing (ES) and command query responsibility segregation (CQRS) are continuing to grow in popularity as the defacto method for implementing distributed systems. However distributed systems come at the cost of being more complicated to implement, and harder to debug due to the fact that an error can span over multiple network boundaries.
Distributed tracing was introduced to help mitigate these debugging issues. OpenTelemetry is a set of open specifications and tools that allow for distributed tracing and metric collection to be accomplished in a standardized and pluggable way. According to the OpenTelemetry website it is defined as “High-quality, ubiquitous, and portable telemetry to enable effective observability”. Within the typelevel ecosystem the otel4s library was developed to “fully and faithfully implement the OpenTelemetry Specification atop Cats Effect.”
In this blog post we will create a mock distributed application and instrument it with distributed tracing using otel4s. This application will be made up of a http server, a gRPC server, the Kafka message broker and multiple data stores. By doing this we will show how we can trace one logical request across multiple network boundaries, and how this can be used for debugging and performance optimization.
The Github repo associated with this demo can be found here
System Design
Below shows the overall design of the system. 
These services take a message as input, do some fake processing modeled by a call to IO.sleep, and then send the message downstream. The http server takes a single POST request located at url path api/v1/push_message which expects a single query param message. The gRPC server exposes a single rpc which takes a BrokerRequest and returns a BrokerResponse The shape of the the broker request and response can be seen below
1
2
3
4
5
6
7
message BrokerRequest {
    string message = 1;
}

message BrokerResponse {
    string message = 1;
}
The same message that is returned by the gRPC service is also pushed to a kafka topic called preprocessed_messages. The elastic, postgres and cassandra consumers all subscribe to the preprocessed_messages topic and pull the messages, do some processing of their own, and then persist it to their respective data store.
Important Concepts
Traces, Spans
Opentelemetry defines three types of signals that can be collected: traces, metrics and logs. In this demo we will only focus on traces and logs
Traces are made up of a tree of spans, which can be thought of as the period of time taken to perform a specific routine. Within each span there can be child spans, events and logs. A log is what you would expect, a text based side effect emitted by the program which is meant to be consumed by the application developer as opposed to the end user. An event is similar except that it has a timestamp that anchors it within a span.
The best way to understand tracing is through an example. Consider the pseudo-code function below. It is made up of four sub-routines. routine_a() takes somewhere between one and two seconds to complete. routine_b() takes exactly half a second to complete and always emits an event with a message attribute equal to “hello world!”. routine_c() takes between two and three seconds to complete and routine_d() takes between half a second and five seconds to complete. routines c and d are run in parallel.
1
2
3
4
def root_routine():
	routine_a()
	routine_b()
	run_parallel(routine_c(), routine_d())
The diagram below represents a visualization of an invocations of root_routine(). We can see spans representing the time taken by each routine as well as any events that occur during said routine. This allows us to clearly see where the performance bottlenecks are within our program.

Context Propagation
In distributed systems traces need to persist across multiple network boundaries. Most transport protocols have some mechanism for storing key-value pairs that hold metadata specific to that request, that should be extracted and acted upon before the actual business logic is performed. HTTP has headers, kafka records have headers and gRPC has metadata. OpenTelemetry creates an abstraction over these key-value stores called a carrier and that is where important data necessary for context propagation is stored. The most important attribute to be stored in the carrier is the traceparent which is an attribute that has the id of the span which initiated the cross-boundary call. The system that receives this traceparent will be able to create a child span appropriately.
The use of traceparent within a carrier is a WC3 standard, and should be followed by all tracing solutions.
Simply put, if a client of some sort (HTTP, kafka producer, etc.) makes a request with the traceparent set within the carrier the application that consumes said request (HTTP, kafka consumer, etc) will be able to pick up the traceparent from that carrier and create a span with the appropriate parent. There exists tooling within the OpenTelemetry/java ecosystem which can automatically instrument applications with context propagation, however these tools are base on JVM threads. Cats-effect uses fibers as its concurrency primitive so these tools do not work. We must instead use tools that use otel4s or build our own.
Context Propagation in Action
Now that we know the basics of context propagation we can start working on the code. Our mock application has three types of network boundaries: HTTP, gRPC and kafka. HTTP context propagation cn be handled by the http4s-otel middleware. However at the time of writing their are no middleware solutions for gRPC and Kafka (that I could find, if I missed something please let me know!). We will write a generic utility for propagating context, centered around the existence of a carrier.
For the sake of brevity we will not go though the build.sbt file, but instead only mention the modules and their purpose. First is the core module. The core module holds the following methods:
1
2
3
4
5
6
7
8
9
10
11
12
13
14
15
16
17
18
19
20
21
22
23
24
25
26
27
28
29
30
31
32
33
34
35
36
37
38
39
40
41
42
43
44
45
46
47
48
49
50
51
52
53
54
55
56
57
58
59
60
61
62
63
64
65
66
67
68
69
70
object Core:

  def randomSleep[F[_]: Async](min: Int, max: Int): F[String] =
    for
      rand <- Random.scalaUtilRandom[F]
      millisecondsToWait <- rand
        .betweenInt(min, max)
        .map(_.milliseconds)
      _ <- Async[F].sleep(millisecondsToWait)
      message = s"waited for ${millisecondsToWait}"
    yield message

  def otelResource[F[_]: Async: LiftIO]: Resource[F, Otel4s[F]] =
    Resource
      .eval(Sync[F].delay(GlobalOpenTelemetry.get))
      .evalMap(OtelJava.forAsync[F])

  def fromTracingCarrier[
      F[_]: Tracer: Concurrent,
      C: Monoid: TextMapGetter,
      O
  ](carrier: C, spanName: String)(body: Span[F] => F[O]): F[O] =
    MonadCancelThrow[F].uncancelable: poll =>
      Tracer[F].joinOrRoot(carrier):
        Tracer[F]
          .spanBuilder(spanName)
          .withSpanKind(SpanKind.Server)
          .build
          .use: span =>
            poll(body(span)).guaranteeCase:
              case Outcome.Succeeded(fa) =>
                span.addAttribute(Attribute("exit.case", "succeeded"))
              case Outcome.Errored(e) =>
                span.recordException(e) >>
                  span.addAttribute(Attribute("exit.case", "errored"))
              case Outcome.Canceled() =>
                span.addAttributes(
                  Attribute("exit.case", "canceled"),
                  Attribute("canceled", true),
                  Attribute("error", true)
                )

  def withTracingCarrier[
      F[_]: Tracer: Concurrent,
      C: TextMapUpdater: Monoid,
      O
  ](spanName: String)(
      body: C => F[O]
  ): F[O] =
    MonadCancelThrow[F].uncancelable: poll =>
      val carrier = Monoid[C].empty
      Tracer[F]
        .spanBuilder(spanName)
        .withSpanKind(SpanKind.Client)
        .build
        .use: span =>
          for
            traceHeaders <- Tracer[F].propagate(carrier)
            resp <- poll(body(traceHeaders)).guaranteeCase:
              case Outcome.Succeeded(fa) =>
                span.addAttribute(Attribute("exit.case", "succeeded"))
              case Outcome.Errored(e) =>
                span.recordException(e) >>
                  span.addAttribute(Attribute("exit.case", "errored"))
              case Outcome.Canceled() =>
                span.addAttributes(
                  Attribute("exit.case", "canceled"),
                  Attribute("canceled", true)
                )
          yield resp
randomSleep and otelResource are used for simulating work, and initializing otel4s respectively. The fromTracingCarrier and withTracingCarrier are used to pick up a traceparent id from a request and propagate a traceparent id respectively. These methods are adapted from the otel4s http-middleware but are modified to center around a carrier type C instead of http headers and Kleisli. The logic of each method is surrounded by an uncancelable block so that no matter what happens when either sending or handling a request, we will be able to set attributes for our span properly. All that our carrier type C needs is a Monoid typeclass so we can create empty carriers, and TextMapUpdater and TextMapGetter typeclasses. The latter two typeclasses essentially allow us to treat the carrier like it is a Map[String, String] so that we can set and get the traceparent value.
The grpc and kafka modules depend on the core module and implement the monoid, TextMapGetter and TextMapSetter typeclasses for gRPC meta and kafka header respectively. This means we now have all the functionality we need to perform context propagation across all our network boundaries.
We can now implement our various services. We will only show the routes class we use in our http service for brevity.
1
2
3
4
5
6
7
8
9
10
11
12
13
14
15
16
17
18
19
final class MyRoutes(
      brokerPreprocessor: BrokerPreprocessorFs2Grpc[IO, Metadata]
  )(using Tracer[IO])
      extends Http4sDsl[IO]:

    object Message extends QueryParamDecoderMatcher[String]("message")

    val routes = HttpRoutes.of[IO] {

      case POST -> Root / "api" / "v1" / "push_message" :? Message(message) =>
        withTracingCarrier[IO, Metadata, BrokerResponse]("grpc client") {
          metaCarrier =>
            brokerPreprocessor
              .processAndPushToBroker(
                BrokerRequest(message = message),
                ctx = metaCarrier
              )
        }.flatMap(br => Ok(br.message))
    }
It takes a gRPC client built for us by fs2-grpc, as an argument and defines a single POST request. Within that POST request it uses the withTracingCarrier method we defined in the core module to prepare a gRPC metadata object with a traceparent value that has been properly set, and then makes a request to the gRPC server using said carrier.
The following code is the implementation of the gRPC server:
1
2
3
4
5
6
7
8
9
10
11
12
13
14
15
16
17
18
19
20
21
22
23
24
25
26
def brokerPreprocessor(
      producer: PartitionsFor[IO, String, String]
  )(using tracer: Tracer[IO]) =
    new BrokerPreprocessorFs2Grpc[IO, Metadata]:
      override def processAndPushToBroker(
          request: BrokerRequest,
          ctx: Metadata
      ): IO[BrokerResponse] =
        fromTracingCarrier(ctx, "grpc server"): s =>
          for
            message <- randomSleep[IO](500, 2500)
            _ <-
              withTracingCarrier[IO, Headers, ProducerResult[String, String]](
                "push to broker"
              ): carrier =>
                producer
                  .produceOne(
                    ProducerRecord(
                      topic_name,
                      "message",
                      s"gRPC preprocessor: $message\t"
                    )
                      .withHeaders(carrier)
                  )
                  .flatten
          yield (BrokerResponse(message = message))
It takes a Kafka producer as and argument and implements an anonymous class of BrokerPreprocessorFs2Grpc to handle gRPC requests. Again take notice of the fromTracingCarrier and withTracingCarrier methods. The former takes in the gRPC metadata class provided by the request handler, and gives us a span that will be a child of the span referenced by the traceparent. After calling randomSleep to simulate some “work” we then call withTracingCarrier to get a kafka headers class that has automatically had context propagation performed on it. We can then use this headers object to push our message to Kafka.
Next we will examine the snippet of code from our elastic consumer that pulls messages from kafka, simulates more “work”, and pushes to them to Elasticsearch. We will not show the code for the postgres and cassandra consumers as they are fairly similar to the elastic consumer.
1
2
3
4
5
6
7
8
9
10
11
12
13
14
15
16
17
18
19
20
21
22
23
24
25
26
KafkaConsumer
  .stream(consumerSettings)
  .subscribeTo("preprocessed_messages")
  .records
  .mapAsync(25) { committable =>
    fromTracingCarrier(
      committable.record.headers,
      "elastic consumer"
    ): s =>
      val (key, value) = processRecord(committable.record)
      randomSleep[IO](500, 2500).flatMap: message =>
        trace
          .spanBuilder("persist to elastic search")
          .withParent(s.context)
          .build
          .surround(
            client.execute:
              indexInto("elastic_messages")
                .fields(
                  key -> s"$value elastic consumer: $message"
                )
                .refresh(RefreshPolicy.Immediate)
          )
  }
  .compile
  .drain
We pull records from our topic and for each record we pass the header to fromTracingCarrier so that way we continue with our trace. We again simulate some work by sleeping for a random amount of time, and then we use the span provided to us by fromTracingCarrier to surround our call to Elasticsearch so we can record exactly how long it took.
Running, Viewing Data and Viewing Traces
We containerize each of our microservices with docker so all of our services can be started using a simple call to docker compose up -d. Give all the services a few seconds to start up and then make a request to the system using the following command:
1
curl -X POST localhost:8080/api/v1/push_message?message=hello!
you should get a response like:
1
waited for 704 milliseconds
Querying our data stores
Next we will query all of our data stores to make sure our message persisted. We will start with Elasticsearch. Navigate to the elasticsearch dev tools console by entering http://localhost:5601/app/dev_tools#/console into a browser. In the console run the following query:
1
2
3
4
5
6
GET elastic_messages/_search
{
  "query": {
    "match_all": {}
  }
}
You should see a entries with a string value containing the original message sent in the post request, the time spent sleeping in the gRPC server and the time spent sleeping in the elastic consumer.
You can do the same by logging into the postgres server using any database tool (I use dbeaver) and running the following query:
1
select  * from postgres_messages;
Again you should see the message followed by the two sleep times.
Finally to log into cassandra and view the contents of the table. Start a CQL shell using docker
1
docker run --rm -it --network oteldemo-network nuvo/docker-cqlsh cqlsh cassandra 9042 --cqlversion='3.4.6'
and run the following query
1
select * from store.cassandra_messages;
Visualizing the Request
To access the jaeger dashboard navigate to http://localhost:16686/search. There should be a service called otel-demo, select it and click “find traces”. Assuming there is only one trace select it (There will be more if you made more requests to the http server). It should look similar to what is below. 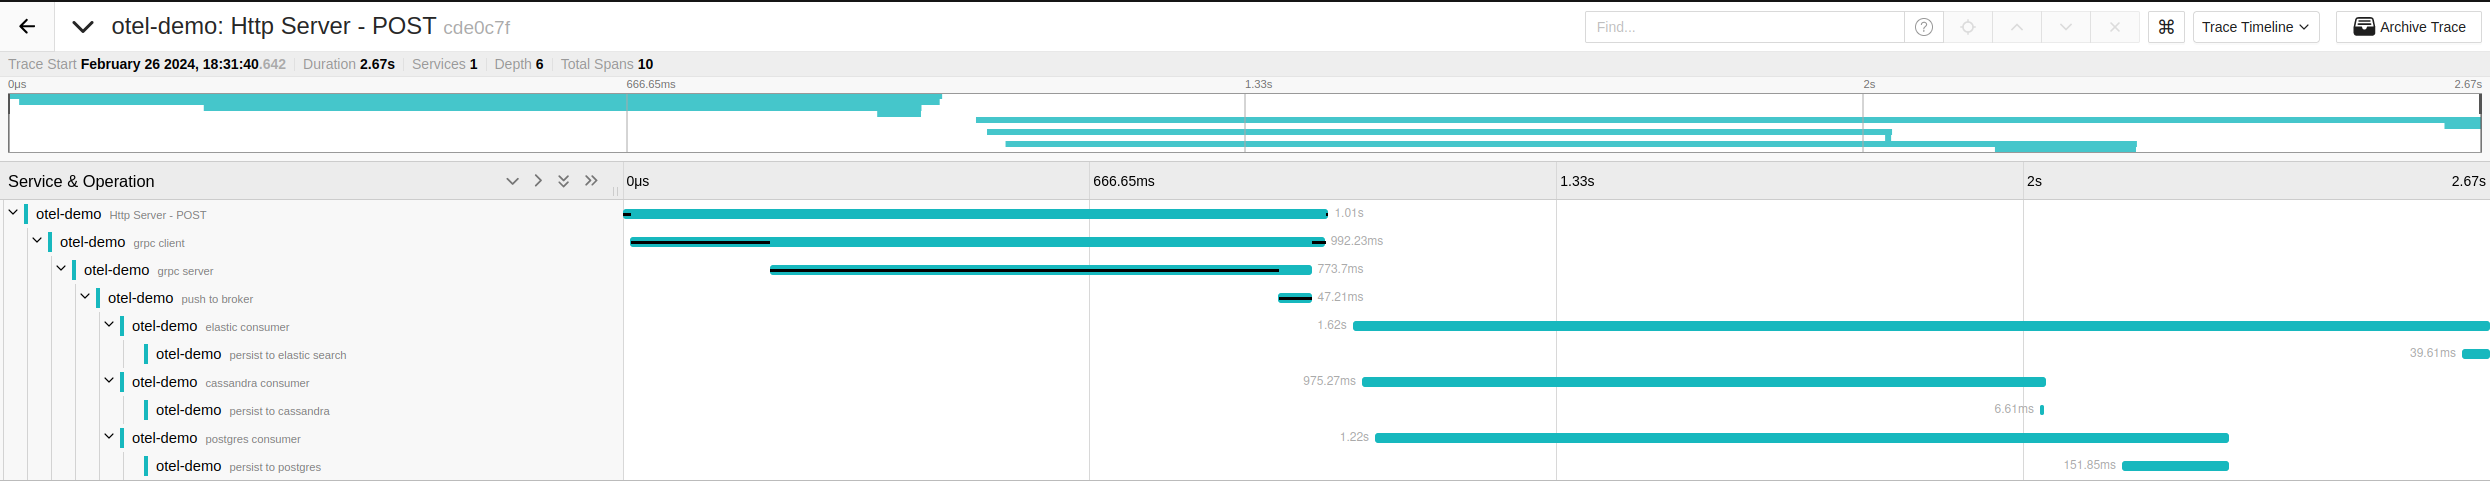
If you have never seen a trace before it may seem like a lot to take in. A good place to start it the Services & Operation tab on the left side. It starts with a root span at the http request. A child span is created, by the withTracingCarrier function we created, when the gRPC client sends a request. Similarly a child span is created when the gRPC server receives the request. Again a new span is created when the gRPC server pushes to Kafka. Until now each span had only one child. Note that when each consumer pulls from kafka they are creating child spans from the same parent span. You can prove this by collapsing spans and seeing which child spans close with them.
By looking at the spans associated with each data store consumer we can see a visual representation of the actual time to persist to each of our datastores. Simply through visual inspection we can see that cassandra was the fastest to persist by a noticeable margin.
Drawbacks to this Approach
Up to this point we have shown how you can use otel4s to instrument services written using the Typelevel stack. Overall it has been a pleasant experience but there is an issue with our approach: withTracingCarrier and fromTracingCarrier pollute our code. It may not seem to matter that much when our applications only have one endpoint, but as our application grows we will have to constantly make calls to these methods. This is repeated code that obfuscates our business logic. A better pattern is the middleware pattern. http4s supports this pattern and that is why we did not have to write any code specific to it, just wrap any servers or clients in the middleware. gRPC and Kafka both have a concept of “interceptors” which serve more or less the same purpose as a middleware does to a web server. Unfortunately, at the time of writing interceptor functionality is not implemented for either fs2-grpc or fs2-kafka.